https://styleguide.umbc.edu/umbc-colors/

Ch 7 General Purpose Embedded Cores

Ryan Robucci

• Spacebar to advance through slides in order • Shift-Spacebar to go back • Arrow keys for navigation
• ESC/O-Key to see slide overview • ? to see help
Printable Version

References

  • ^\dagger From Chapter 7 A Practical Introduction to Hardware/Software Codesign

uP is the most successful prog. hardware

  • Microprocessor is the most successful programmable hardware
  • Reasons:
    1. Abstraction: Separation of hardware and software by definition of an Instruction Set or Instruction Set Architecture (ISA). An ISA includes a specification of the set of opcodes and the the native commands implemented by a processor (https://en.wikipedia.org/wiki/Instruction_set)
  1. Tools (compilers and assemblers) allow designers to create applications and design in a high-level programming language
  2. Reuse, in general, is the ability to save design effort over multiple applications. Microprocessors themselves, the core and peripherals attached to them through bus connections, and high-software for microprocessors all represent reuse enable by use microprocessors
  3. Scalability: Microprocessors have themselves scaled to larger word lengths and have also been involved in scaling to multi-processor systems and SoCs

Typical Microprocessor Toolchain

  • A compiler or assembler converts source code into object code
  • Object Code file contains opcodes (instructions) and constants, and the supporting information to organize them in memory
  • A linker combines object code files into a single standalone executable file. It resolves unknowns such as addresses of variables or entry points for routines.
  • At minimum a processor requires the processing unit and memory for instructions
  • A loader (part of OS) is responsible for loading the executable and libraries into instruction memory for execution.
  • Typically to have separate memory space defined for program memory, mutable data memory, and constants
  • The processor fetches instructions from memory and uses its datapath to execute them.

Cross Compiler

  • C program with function calls, arrays, and global variables:
  • A cross-compiler is required to create an executable for a processor different from the processor used to the compiler.
  • We will make use of the GNU compiler toolchain.
  • Following commands run arm-linux-gcc. The default behavior covers both compiling and linking.
    • -c flag ends the compilation before linking process.
    • -S flag is used to create assembly code.
    • -O2 flag selects the optimization level.
  • The command to generate the ARM assembly program is as follows.
    $> /usr/local/arm/bin/arm-linux-gcc -c -S -O2 gcd.c -o gcd.s
  • The command to generate the ARM ELF executable is as follows.
    $> /usr/local/arm/bin/arm-linux-gcc -O2 gcd.c -o gcd

Elements of Assembly

  • Labels are symbolic directives for branch/jump and symbolic locations for variables.
  • variables, a and b are addressed by the label .L19 and .L19+4 respectively.
  • Assembler directives start with a dot; they do not make part of the assembled program, but are used by the assembler.

Object Code Dump

  • micro-processor works with object code, binary opcodes generated out of assembly programs.
  • compiler tools can re-create the assembly code out of the executable format, called disassembly
  • This is achieved by the objdump program, a program in the gcc toolchain.
  • The following command shows how to retrieve the opcodes for the gcd program:
    $> /usr/local/arm/bin/arm-linux-objdump -d gcd

RISC Pipeline

  • Pipeline processor trades latency for throughput. Typically uses higher clock rates. Uses hardware parallelism and works on more than one instruction at a time.
  • 5-stage Pipeline shown
  • Also common to see 3-stage pipeline with Execute, Buffer and Writeback as a single stage
  • 5-stage has more cycle latency, but faster clock speeds mitigate this
  • Instruction Fetch: The processor retrieves the instruction addressed by the program counter register from the instruction memory.
  • Instruction Decode: The processor examines the instruction opcode. For the case of a branch-instruction, the program counter will be updated. For the case of a compute-instruction, the processor will retrieve the processor data registers that are used as operands.
  • Execute: The processor executes the computational part of the instruction on a datapath. In case the instruction will need to access data memory, the execute stage will prepare the address for the data memory.
  • Buffer: In this stage, the processor may access the data memory, for reading or for writing. In case the instruction does not need to access data memory, the data will be forwarded to the next pipeline stage.
  • Write Back: In the final stage of the pipeline, the processor registers are updated.

Stalling and Hazards

  • Instructions may not always execute in 5-cycles The progression of an instruction through the pipeline must be stalled when a hazard on one of the following types occurs:
  • Control Hazards: pipelined hazards cause by branches
  • Data Hazards: pipeline hazards caused by unfulfilled data dependencies
  • Structural Hazards: operations that require multi cycles due to the limited resources, such as multiple additions when only one is available, or an operation to copy multiple memory address locations to a set of registers, as well as memory latency. Systems with caches cause variability in times due to uncertainty of cache misses.

Control Hazard

  • Interlock hardware makes results of compare available to the following branch command directly rather than having the pipeline wait for the status register to be updated and read
  • The following instruction must be canceled resulting in a wasted slot when jump occurs, unless a delayed branch instruction exists there

Delayed Branch Instruction

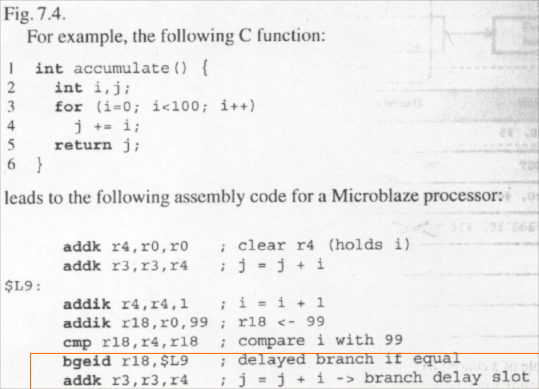
  • The delayed-branch instruction for Microblaze (Xilinx Soft Processor) is bgeid Branch Immediate if Greater or Equal with Delay, bgei is Branch Immediate if Greater or Equal

https://www.xilinx.com/support/documentation/sw_manuals/xilinx2017_3/ug984-vivado-microblaze-ref.pdf#page=199

  • The instruction just after the branch corresponds to the loop body j‘ = j + i. Because it is in a branch delay slot, it will be executed regardless if the conditional branch is taken or not.

Data Hazards and Data Forwarding

  • Data hazards occur when a instruction must wait on the results of a previous instruction. Interlock hardware can resolve some dependencies by data forwarding, a hardware supported process by which results are made directly available to another instruction in the pipeline.
  • However, sometimes a hazard is unavoidable. In the example, the add must wait for the slow memory read ldr. In general, data hazards in a pipeline are predictable and may be analyzed at compile time, though caching and other variable-time memory access patterns exceptions to this.

Structural Hazard

  • Structural hazards are those caused by a limitation in the number of hardware units available, limited hardware capability, hardware bandwidth, memory port width, communication bus restrictions, or conditions like cache contents
    Can be caused by type of instructions in the pipeline: example is multiple add instructions where only a single hardware adder is available

Predictable Timing

  • Predictable timing may be important for an embedded design, sometimes more important than fastest speed. Understanding the hardware pipeline, hazards, and interlock hardware is a critical aspect of understanding timing (esp what is predictable and what is not)
  • Knowing hardware can lead to optimized software implementation...sometimes requiring analysis or coding in assembly
  • Understanding OS is another concern.
    • Unless a program is given uninterrupted access to the microprocessor timing can be difficult to analyze – especially for cache behavior Some OS will support turning off interrupts at least temporarily to ensure atomic execution of pieces of code.
  • A real-time system is characterized by the ability to make time guarantees to complete tasks. A real-time OS only schedules processes with achievable deadlines

Program Organization - Data Types

  • Mapping from C data types to physical memory locations is affected by several factors.
    • Endianess: big-endian higher-significance bits stored at lower (first) address. Little endian is the opposite. Consider bit ordering as well esp in communication
    • Alignment: addressing requires data types to be aligned to word boundaries define by the hardware. Therefore, a byte variable followed by a word in a struct, may may have waste some space in order to allow a loading in a single memory fetch. More compact storage may be supported by the compiler with flags and extra instruction to fetch and assemble data

Examining Data Storage

  • Checking Endianess
    • A little endian processor will print 78563412 while a big-endian processor will print 12345678.
  • A similar program can be written to examine alignment.
  • Consider a struct variable
        typedef struct {char a; int b;} test_t.
        test_t test;
    
  • Define a char * cPtr, give it the address of your struct (use explicit casting) and print its dereferenced value as you advance the pointer forward in memory. This can be useful to understand struct packing compiler options.
  • ARM is bi-endian – it can be configured to work either way

Variables in the Memory Hierarchy

  • Memory hierarchy creates the illusion of very fast memory space.
  • Cache provides a local copy of variables, which can be used when the variable is access multiple times by a C program.
  • Cache is optional in embedded processors. High-end processors may have multiple levels of cache.
  • Again, consider how an OS or other CPU sharing among processes affect cache behavior for a program.

Transparency of Memory to (Basic) C Program

  • Pg 208 code listing showing example of pulling data from memory to registers, operating on them , and then sending data back to memory. As can be seen by the disassembly, the use of memory for an accumulator is very inefficient.

    void accumulate (int *c, int a[10]) {
      int i;
      *c = 0;
      for (i=0; i<10; i++)
        *c += a[i];
    }
    

/usr/local/arm/bin/arm-linux-gcc -02 -c -S accumulate.c

Storage Class Specifiers and Type Qualifiers

  • Limited control of mapping of variables in the memory hierarchy is provided in C. It is offered through storage class specifiers and type qualifiers. Important ones are show in table 7.2. Some examples provided here:
  • These are important for access to memory mapped interfaces, which are hardware software interfaces that appear as memory locations to software. We discussed this in Chapter 11


Function Calls

  • Understanding functions calls is key to mastering the complexity of C programs
  • Examining Object Code from Executable Using Disassembly Command (-d)
/usr/local/arm/bin/arm-linux-gcc -O2 -c accumulate.c -o accumulate.o
/usr/local/arm/bin/arm-linux-objdump -d accumulate.o

C

int accumulate (int a[10]) {
  int i;
  int c = 0;
  for (i=0; i<10;i++)
    c += a[i];
  return c;
}

int a[10];
int one = 1;
int main() {
  return one + accumulate(a);
}
  • Arguments and return value of the accumulate function are passed through register r0 rather than main memory.

text pg 210: (slightly modified)

“Close inspection of the instructions reveals many practical aspects of the runtime layout of this program, and in particular of the implementation of function calls.” instruction that branches into function accumulate is implemented at address 0x2c with a bl instruction - branch with link. copies the program counter into into separate link register lr, and loads the address of the branch target into the program counter. A return-from-subroutine can now be implemented by copying the link register back into the program counter. This is shown at address 0x1c in accumulate. Obviously, care must be taken when making nested subroutine calls so that lr is not overwritten. In the main function, this is solved at the entry, at address 0x24. There is an instruction that copies the current contents of lr into a local area within the stack, and at the end of the main function the program counter is directly read from the same location. The arguments and return value of the accumulate function are passed through register r0 rather than main memory. This is obviously much faster, appropriate when only a few data elements need to be copied. The input argument of accumulate is the base address from the array a. Indeed, the instruction on address 8 uses r0 as a base address and adds the loop counter multiplied by 4. This expression thus results in the effective address of element a [i] as shown on line 5 of the C program (Listing 7.4). The return argument from accumulate is register r0 as well. On address 0x18 of the assembly program, the accumulator value is passed from r1 to r0.

Stack Frame

  • In general, arguments are passed between functions through a data structure known as a stack frame
  • Stack frame includes the return address, the local variables, and the input and output argument of the function, and the location of the calling stack frame
  • For ARM processors, the full details of the procedure-calling convention are defined in the ARM Procedure Call Standard (APCS), a document used by software engineers writing compilers and software library developers.

Full-Fledged Stack Frame

  • Compiling without optimizations to see Full-Fledged Stack Frame:
    /usr/local/arm/bin/arm-linux-gcc -c -S accumulate.c
  • Compiling WITHOUT OPTIMIZATIONS utilizes a full-fledged stack frame which conservatively uses main memory to transfer data instead of attempting to use registers (such as to pass arguments)
pg. 212: The instructions on lines 2 and 3 are used to create the stack frame. On line 3, the frame pointer (fp), stack pointer (sp), link register or return address (lr) and current program counter (pc) are pushed onto the stack. The single instruction stmfd is able to perform multiple transfers (m), and it grows the stack downward (fd). These four elements take up 16 bytes of stack memory. On line 3, the frame pointer is made to point to the first word of the stack frame. All variables stored in the stack frame will now be referenced based on the frame pointer fp. Since the first four words in the stack frame are already occupied, the first free word is at address fp - 16, the next free word is at address fp – 20 and so on. These addresses may be found back in Listing 7.6. The following local variables of the function accumulate are stored within the stack frame: the base address of a, the variable i, and the variable c. Finally on line 31, a return instruction is shown. With a single instruction, the frame pointer fp, the stack pointer sp, and the program counter pc are restored to the values just before calling the accumulate function.

Program Layout

  • Mentally distinguish program storage in a file or ROM vs how it is stored when loaded. The latter includes dynamic memory structures that change at runtime, like the stack (such as used for local variables and stack frames) and the heap (used for dynamic memory allocation e.g. malloc and free).
  • In example:
    • .text segment maps into fast static RAM
    • .data, stack and heap segments map into DDR RAM
    • dynamic data (heap), local data (stack) and global data (bss) are example sections of run-time memory segments that do not correspond to a single section in the elf files

ELF Layout

  • The ELF (Executable Linkable Format) is one standard for executable file storage. Organized into sections, with common ones:
    • .text code segment, contains the binary instructions
    • .data contains initialized data including constants
    • Debugging info to allow mapping back to lines of C code

Run Time Memory Layout

  • .data segment contains any global or static (static local) variables which have a pre-defined value and can be modified. This run-time memory space does not change its size at run time (might also be segmented into read-only and read-write areas e.g. .rodata ans .rwdata)
    • Ex: int val = 3; or char string[] = "Hello World";
    • The initialization values are typically stored in ROM and or stored directly within .text and copied by the program into the.data segment at run time.
  • .bss segment contains all global variables and static variables that are initialized to zero or don’t have explicit initialization in source code
    • Ex: static int i;
  • The heap area is shared by all threads, shared libraries, and dynamically loaded modules in a process and supports dynamic memory allocation
  • Stack is a LIFO structure supported in hardware by a stack pointer to track the top of the stack

Stack and Heap Collision

  • A common memory organization has the stack growing towards and possibly into the heap area while the heap have variable space allocated closer and closer to the stack as more space is allocated
  • A collision occurs for instance when the stack grows into the heap space. stack frames and heap variables there can be corrupted. This is a common cause of random-like behavior of program counter as corrupted return address values are read from the stack. This can be seem when observing a running a program using a hardware debugging interface. It is very difficult to identify this problem through traditional debugging and only experience will tell you where to look for an explanation.
  • Later we will discuss examining code section size.

Examining Size

  • toolchains include a size utility (e.g. arm-linux-size) to show the static size of a program – the amount of memory required to store instructions, constants, and global variables
    • Shows 300 bytes in text, 16 bytes in initialized data, 0 bytes in the uninitialized data sections
    • The total is given in dec and hex
  • The size utility can analyze the executable as well, which includes the linked libraries.
  • Libraries have a large impact on code size (and execution time) and should be selected with care in resource-constrained environments.
  • Often there are alternative low-foot print/lightweight alternatives provided for standard functions (: printf)
  • Note, the size utility does not show dynamic memory usage, and cannot predict the amount of stack or heap required since they are not determined by code compilation
  • A programmer must select the size for these based on factors link expected function call depth and number of local variables in those functions.

Examining Sections

  • Reports on the text, data, bss sections along with additional sections like debugging info can be listed using the -h flag of objdump to get section header listing from the elf file
    • VMA (virtual memory address) represents the location within the elf file
    • LMA (load memory address) represents the location in memory at runtime

Examining Symbols

  • Symbols may be viewed using the -t flag with the objdump utility
    • Note num and res in the .rwdata and .bss sections respectively
  • Can also examine symbols using -Wl , -Map=.. option with linker to see the linker map file. This includes a listing of the object files used to create the executable.

Examining assembly code

  • Provided by -S with compiler (gcc)
  • Creates modulo.s:
  • Also provided from disassembly of object or executable using objdump utility with the -D flag
  • Being able to investigate assembly code (even for processors foreign to you) enables you to
    • understand what a compiler can and will do, and the effect of compiler optimizations.
    • make more accurate decisions on potential software performance (ex: Use of stack frames vs registers)
    • understand timing of code, which can be very important for hardware interfacing.

  • From assembly, we can identify a similar optimization that would otherwise be directly done in C using pointer arithmetic

Application Binary Interface (ABI)

  • ABI defines how a processor will used its registers to implement a C program, particularly the interface between to program modules at the machine code level
    • Function calls often from libraries or system calls

https://en.wikipedia.org/wiki/Application_binary_interface

  • ABIs cover details such as:
    • the sizes, layout, and alignment of data types
    • the calling convention, which controls how functions' arguments are passed and return values retrieved; for example, whether all parameters are passed on the stack or some are passed in registers, which registers are used for which function parameters, and whether the first function parameter passed on the stack is pushed first or last onto the stack
    • how an application should make system calls to the operating system and, if the ABI specifies direct system calls rather than procedure calls to system call stubs, the system call numbers
    • and in the case of a complete operating system ABI, the binary format of object files, program libraries and so on.
  • A complete ABI allows a program from one operating system supporting that ABI to run without modifications on any other such system, provided that necessary shared libraries are present, and similar prerequisites are fulfilled.
  • Other ABIs standardize details such as the C++ name mangling, exception propagation, and calling convention between compilers on the same platform, but do not require cross-platform compatibility.

Embedded-application binary interface

https://en.wikipedia.org/wiki/Application_binary_interface

  • An embedded-application binary interface (EABI) specifies standard conventions for file formats, data types, register usage, stack frame organization, and function parameter passing of an embedded software program.
  • Compilers that support a given EABI create object code that is compatible with code generated by other compilers supporting the same EABI, allowing developers to link libraries generated with one compiler with object code generated with another compiler. Developers writing their own assembly language code may also use the EABI to interface with assembly generated by a compliant compiler.
  • The main differences between an EABI and an ABI for general-purpose operating systems are that privileged instructions are allowed in application code, dynamic linking is not required (sometimes it is completely disallowed), and a more compact stack frame organization is used to save memory. The choice of EABI can affect performance.
  • Widely used EABIs include PowerPC, ARM EABI2 and MIPS EABI.

Processor Simulation

  • Many processors can be simulated with an instruction-set simulator, a simulator design to simulate the behavior a a specific processor
  • A cosimulation platform is one that supports different description languages/formats or different types of simulation.
    • An example would be a hardware (hdl) and software.
  • Book provides a discussion on gplatform.

Instruction Set Simulator vs. Cycle-Accurate Simulator

  • An instruction set simulator accurately predicts the results of the software execution, but not necessarily what happens in every clock cycle. It is optimized for speed.
  • Cycle-accurate simulation predicts what results at the by the end of every clock cycle. This can include external behavior such as port and memory reads, or also key internal components such as status registers. The exact hardware and precise timing within a clock cycle are not modeled. The type of simulators provide more detail on subtle processor-specific aspects of each instruction’s execution.

Need for simulation

  • (Why perform “dynamic simulation” vs “static analysis”)
  • Performance events such as stalls, cache misses are not easily predicted from static code analysis alone. Some are in fact data-dependent (statistical analysis/reporting may be appropriate). Analysis using a dynamic simulation of program execution on a processors is needed.
  • One problem with simulation reporting is that a detailed account of every instruction’s progression in the pipeline would represent a large amount of data.
  • Typically a simulation platform will support a method to define where in the code analysis reporting should be performed
  • Ex. using “fake” assembly software interrupt instruction is shown on pg. 225 (next slide). Other simulators might use special commands embedded in code comments.
  • Example use of pseduo-system call using a software interrupt with immediate value 514 which is an otherwise meaningless value (>255)
int gcd (int a, int b){
  while (!=b) {
    if (a > b)
      a = a - b;
    else
      b = b - a;
  }
  return a;
}

void instructiontrace(unsigned a){}
  asm("swi 514");
}

int main() {
  instructiontrace(1);
  a = gcd(6, 8);
  instructiontrace(0);
  printf("GCD = \%d\n", a);
  return 0;
}
/usr/local/arm/bin/arm-linux-gcc -static -S gcd.c -o gcd.S

Example Reporting Information from Simulator

  • Example listing using SimIt-ARM
    • Cycle: cycle count at the fetch
    • Addr: location in program memory
    • Opcode: the instruction opcode
    • P: Pipeline miss-speculation. 1 indicates removal from pipeline
    • I: Instruction-cache miss.
    • D: Data-cache miss
    • Time: total time instruction is in the pipeline
    • Mnemonic: Assembly code
  • Can understand significance and causes cache misses, stalls (type of hazard), canceled instructions, etc..
  • Can redesign code, compilation options, processor, caches sizes, etc..
Fig 7.12 Mapping of address 0x8524 in a 32-set, 16-line, 32-bytes-per-line set-associative cache

Use of HDL for processor simulation

  • HDL simulation can replace a instruction-set simulator and provide more detail but there are caveats
  • Need a (detailed) model to perform detailed simulation. Can be a problem with complex protected IP
  • Typically slower – though more detail is available a higher level abstraction may be appropriate
    • (Same trade-off with behavioral vs gate-level)
  • HDL simulation can be more cumbersome, such as loading program memory. A dedicated tool makes this process manageable
  • Using a uniform HDL simulation platform to replace cosimulation represents a loss of abstraction for analysis and understanding, such as the hardware – software divide where different types of analysis and tools may be appropriate